by Felix Scholder
#informationGraphics #installation
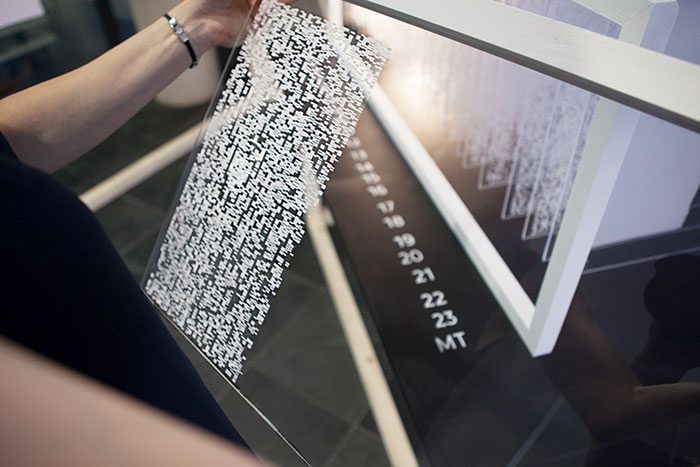
This image shows the 24 Chromosomes of two friends. The black spots show which parts of their DNA they have in common.
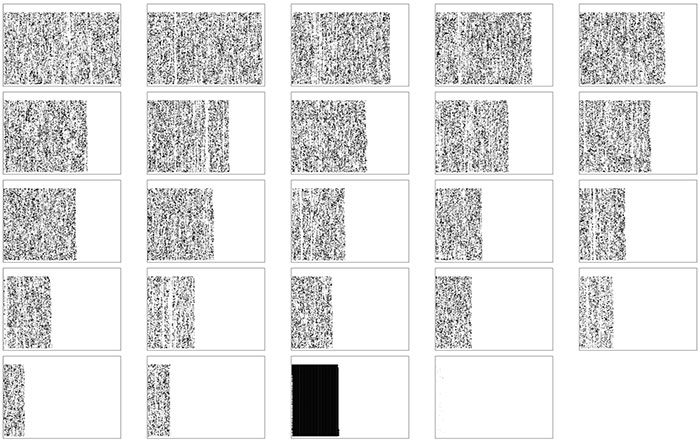
The human DNA contains around 3.295 billion base pairs. Approximately 99.9% of the human genome is identical. However, a relatively small number of base pairs makes a significant difference in our appearance.

The analysis of the differences allow us to predict details about the origin, physical characteristics or genetic diseases of a person. I depicted the marginal differences between two DNA profiles as infographics and made them physically tangible as a data sculpture.